HackKing’s is a 12 hour hackathon organised by KCL Tech and sponsored by BlackRock. Working as a team of 5, we had to create a product to answer the challenge statement: “How can we take advantage of the changing technological landscape to contribute to a better future”.

Our Solution
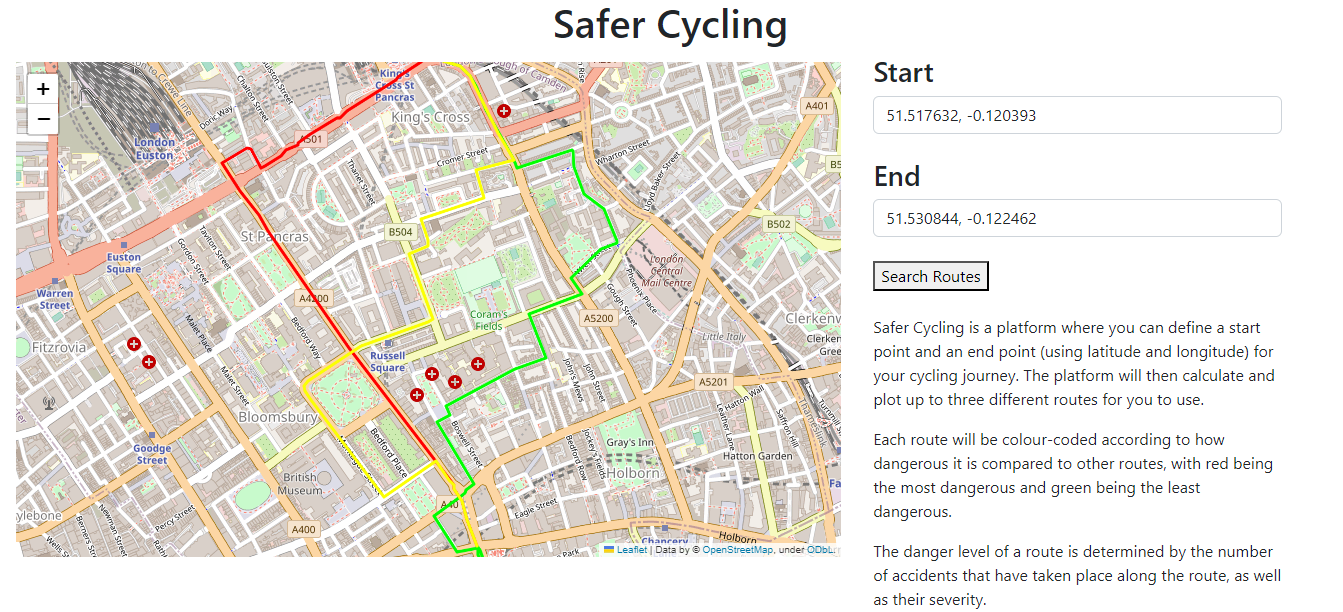
After spending some time brainstorming ideas, browsing Kaggle datasets and looking at various APIs, my team decided to create a website that will help users find safe cycling routes in London. Cycling is healthy, cheap and good for the environment. However, some people may be afraid to bike on the bustling streets of the capital; in 2021, there were 999 cyclists killed or seriously injured in Greater London.
That’s where our solution comes in. Users provide latitude and longitude coordinates of a start and end location. The application will then display up to three routes, each one color-coded based on how dangerous it is. Users can then select their preferred route and cycle to their destination with their minds at ease.
Details
To work out how dangerous a route is, we first use the TFL API to get data about accidents involving cyclists from 2009 - 2019. This data is grouped by location and totalled: this is done by rounding the latitude and longitude to 4 decimal places, which makes locations close together have the same coordinates. Different weights are assigned to different severities of accidents, with fatal injuries being weighted more heavily than serious injuries, which are weighted more heavily than slight injuries. The sum of the weights for each location is then saved in a .csv file, ready to be used by the application. This step needs to be run only once, unless you wish to update the data.
When the user provides a start and end location, we use the openrouteservice API to request 3 routes between them. We compare the coordinates along a route to those stored in the csv file, summing up the severity weight for each location to get a total for each route. The routes are then colored based on their relative severity weights and displayed on a map.
We used Python to code our application and Flask for the website. The map display was done using Folium.
Reflection
During this project I had the chance to learn more about APIs, a subject that was fairly new to me, at least in practice. We used two different APIs, in two different ways (querying the API endpoint and using a Python package). This allowed me to get more comfortable with the topic by getting hands-on experience.
One challenge we faced was coming up with an idea for our solution at the beginning. This left us with less time for implementation and our solution suffered as a result. That being said, I think it was important to select a good idea; after all, with additional time our solution could always be improved, but once you settle on an idea it’s much harder to change it if you come up with something better (most often you would need to start again from scratch). Still, we should have been a bit faster in our deliberation.
Although we didn’t win any prizes for our solution, it was a fun experience to work alongside friends and strangers alike, manage our limited time and learn new skills!